public static string GetIPAddress()
{
String strHostName = string.Empty;
strHostName = Dns.GetHostName();
IPHostEntry ipEntry = Dns.GetHostEntry(strHostName);
IPAddress[] addr = ipEntry.AddressList;
string IPAddress=string.Empty;
for (int i = 0; i < addr.Length; i++)
{
IPAddress = addr[1].ToString();
}
return IPAddress;
}
Tuesday, December 28, 2010
Saturday, August 21, 2010
Custom settings in Web.Config
Ever felt the need to switch settings in your web application based on the server it was running on? Well, I have. Suppose you have a connection string in your Web.Config (encrypted, sure). You don't want to be changing the configuration manually everytime you switch from development, to testing and to production. So here's what I do.
First, you create a new section in the Web.Config file.
The mySettings element is inserted as a child of the configuration root element in your Web.Config.
[mySettings]
[!-- development --]
[Configuration url="http://localhost"]
[add key="ConnectionString" value="server=(local);database=Northwind;user id=sa;password=..." /]
[add key="SettingWhatEver" value="true" /]
[/Configuration]
[!-- testing --]
[Configuration url="http://testserver"]
[add key="ConnectionString" value="server=testserver;database=Northwind;user id=dbusr_test;password=..." /]
[add key="SettingWhatEver" value="true" /]
[/Configuration]
[!-- production --]
[Configuration url="http://liveserver"]
[add key="ConnectionString" value="server=prodserver;database=Northwind;user id=dbusr_prod;password=..." /]
[add key="SettingWhatEver" value="false" /]
[/Configuration]
[/mySettings]
*** note here [=< and ]=>
Then, you create a custom section handler for the Web.Config file.
using System.Collections;
using System.Xml;
using System.Configuration;
public class MySettings : Hashtable, IConfigurationSectionHandler
{
public object Create(object parent, object configContext, System.Xml.XmlNode section)
{
string HostUrl = HttpContext.Current.Request.Url.Host;
XmlNode NodeSetting = null;
XmlNodeList NodeSettings = null;
Hashtable Settings = new Hashtable();
NodeSettings = section.SelectNodes("Configuration[contains(@url,'" + HostUrl + "')]/add");
foreach (XmlNode NodeSetting_loopVariable in NodeSettings) {
NodeSetting = NodeSetting_loopVariable;
this.Add(NodeSetting.Attributes.GetNamedItem("key").Value, NodeSetting.Attributes.GetNamedItem("value").Value);
}
return this;
}
}
This section handler will read from the mySettings element, and select the node with the url-attribute that contains the HostUrl value. This is a simple XPath expression, perhaps you want to finetune it depending on your needs.
Finally, you go back to the Web.Config and make sure the section is understood and read by adding this element to the Web.Config
The first attribute holds the custom section name in the Web.Config. The second attribute holds the class that will handle this section (WebApp.MySettings) and the assembly where this class can be found. The section handler is located right under the configuration root element, but before the mySettings element mentioned above. Be aware that XML is case-sensitive.
Now that your done, you can access the desired setting through:
string constr = ConfigurationManager.GetSection("mySettings")("ConnectionString");
Depending on the host you are running the web application on, this will return the development, testing or production connection string.
Tuesday, July 13, 2010
.Net framework architecture image
 |
| .Net framework Architecture |
This image is to understand .Net framework architecture or to have a good idea of the flow
Friday, June 25, 2010
SQL Date and Time Functions
SELECT convert(varchar, getdate(), 100) -- mon dd yyyy hh:mmAM (or PM)
-- Oct 2 2010 11:01AM
SELECT convert(varchar, getdate(), 101) -- mm/dd/yyyy - 10/02/2010
SELECT convert(varchar, getdate(), 102) -- yyyy.mm.dd - 2010.10.02
SELECT convert(varchar, getdate(), 103) -- dd/mm/yyyy
SELECT convert(varchar, getdate(), 104) -- dd.mm.yyyy
SELECT convert(varchar, getdate(), 105) -- dd-mm-yyyy
SELECT convert(varchar, getdate(), 106) -- dd mon yyyy
SELECT convert(varchar, getdate(), 107) -- mon dd, yyyy
SELECT convert(varchar, getdate(), 108) -- hh:mm:ss
SELECT convert(varchar, getdate(), 109) -- mon dd yyyy hh:mm:ss:mmmAM (or PM)
-- Oct 2 2010 11:02:44:013AM
SELECT convert(varchar, getdate(), 110) -- mm-dd-yyyy
SELECT convert(varchar, getdate(), 111) -- yyyy/mm/dd
-- yyyymmdd - ISO date format - international standard - works with any language setting
SELECT convert(varchar, getdate(), 112) -- yyyymmdd
SELECT convert(varchar, getdate(), 113) -- dd mon yyyy hh:mm:ss:mmm
-- 02 Oct 2010 11:02:07:577
SELECT convert(varchar, getdate(), 114) -- hh:mm:ss:mmm(24h)
SELECT convert(varchar, getdate(), 120) -- yyyy-mm-dd hh:mm:ss(24h)
SELECT convert(varchar, getdate(), 121) -- yyyy-mm-dd hh:mm:ss.mmm
SELECT convert(varchar, getdate(), 126) -- yyyy-mm-ddThh:mm:ss.mmm
-- 2010-10-02T10:52:47.513
-- Without century (YY) date / datetime conversion - there are exceptions!
SELECT convert(varchar, getdate(), 0) -- mon dd yyyy hh:mmAM (or PM)
SELECT convert(varchar, getdate(), 1) -- mm/dd/yy
SELECT convert(varchar, getdate(), 2) -- yy.mm.dd
SELECT convert(varchar, getdate(), 3) -- dd/mm/yy
SELECT convert(varchar, getdate(), 4) -- dd.mm.yy
SELECT convert(varchar, getdate(), 5) -- dd-mm-yy
SELECT convert(varchar, getdate(), 6) -- dd mon yy
SELECT convert(varchar, getdate(), 7) -- mon dd, yy
SELECT convert(varchar, getdate(), 8) -- hh:mm:ss
SELECT convert(varchar, getdate(), 9) -- mon dd yyyy hh:mm:ss:mmmAM (or PM)
SELECT convert(varchar, getdate(), 10) -- mm-dd-yy
SELECT convert(varchar, getdate(), 11) -- yy/mm/dd
SELECT convert(varchar, getdate(), 12) -- yymmdd
SELECT convert(varchar, getdate(), 13) -- dd mon yyyy hh:mm:ss:mmm
SELECT convert(varchar, getdate(), 14) -- hh:mm:ss:mmm(24h)
SELECT convert(varchar, getdate(), 20) -- yyyy-mm-dd hh:mm:ss(24h)
SELECT convert(varchar, getdate(), 21) -- yyyy-mm-dd hh:mm:ss.mmm
SELECT convert(varchar, getdate(), 22) -- mm/dd/yy hh:mm:ss AM (or PM)
SELECT convert(varchar, getdate(), 23) -- yyyy-mm-dd
SELECT convert(varchar, getdate(), 24) -- hh:mm:ss
SELECT convert(varchar, getdate(), 25) -- yyyy-mm-dd hh:mm:ss.mmm
-- SQL create different date styles with t-sql string functions
SELECT replace(convert(varchar, getdate(), 111), '/', ' ') -- yyyy mm dd
SELECT convert(varchar(7), getdate(), 126) -- yyyy-mm
SELECT right(convert(varchar, getdate(), 106), 8) -- mon yyyy
SELECT substring(convert(varchar, getdate(), 120),6, 11) -- mm-dd hh:mm
------------
-- SQL Server date formatting function - convert datetime to string
CREATE FUNCTION dbo.fnFormatDate (@Datetime DATETIME, @FormatMask VARCHAR(32))
RETURNS VARCHAR(32)
AS
BEGIN
DECLARE @StringDate VARCHAR(32)
SET @StringDate = @FormatMask
IF (CHARINDEX ('YYYY',@StringDate) > 0)
SET @StringDate = REPLACE(@StringDate, 'YYYY', DATENAME(YY, @Datetime))
IF (CHARINDEX ('YY',@StringDate) > 0)
SET @StringDate = REPLACE(@StringDate, 'YY', RIGHT(DATENAME(YY, @Datetime),2))
IF (CHARINDEX ('Month',@StringDate) > 0)
SET @StringDate = REPLACE(@StringDate, 'Month', DATENAME(MM, @Datetime))
IF (CHARINDEX ('MON',@StringDate COLLATE SQL_Latin1_General_CP1_CS_AS)>0)
SET @StringDate = REPLACE(@StringDate, 'MON',
LEFT(UPPER(DATENAME(MM, @Datetime)),3))
IF (CHARINDEX ('Mon',@StringDate) > 0)
SET @StringDate = REPLACE(@StringDate, 'Mon', LEFT(DATENAME(MM, @Datetime),3))
IF (CHARINDEX ('MM',@StringDate) > 0)
SET @StringDate = REPLACE(@StringDate, 'MM',
RIGHT('0'+CONVERT(VARCHAR,DATEPART(MM, @Datetime)),2))
IF (CHARINDEX ('M',@StringDate) > 0)
SET @StringDate = REPLACE(@StringDate, 'M',
CONVERT(VARCHAR,DATEPART(MM, @Datetime)))
IF (CHARINDEX ('DD',@StringDate) > 0)
SET @StringDate = REPLACE(@StringDate, 'DD',
RIGHT('0'+DATENAME(DD, @Datetime),2))
IF (CHARINDEX ('D',@StringDate) > 0)
SET @StringDate = REPLACE(@StringDate, 'D', DATENAME(DD, @Datetime))
RETURN @StringDate
END
GO
Thursday, June 3, 2010
What is the relation between tcp/ip and http ?
TCP is one of the core protocols of the Internet Protocol Suite. - TCP is one of the two original components of the suite (the other being Internet Protocol, or IP), so the entire suite is commonly referred to as TCP/IP. Whereas IP handles lower-level transmissions from computer to computer as a message makes its way across the Internet, TCP operates at a higher level, concerned only with the two end systems, for example a Web browser and a Web server. In particular, TCP provides reliable, ordered delivery of a stream of bytes from a program on one computer to another program on another computer. Besides the Web, other common applications of TCP include e-mail and file transfer. Among other management tasks, TCP controls segment size, flow control, and data exchange rate.
HTTP is an Application Layer protocol for distributed, collaborative, hypermedia information systems.
HTTP is a request-response standard typical of client-server computing. In HTTP, web browsers or spiders typically act as clients, while an application running on the computer hosting the web site acts as a server. The client, which submits HTTP requests, is also referred to as the user agent. The responding server, which stores or creates resources such as HTML files and images, may be called the origin server. In between the user agent and origin server may be several intermediaries, such as proxies, gateways, and tunnels.
HTTP is not constrained in principle to using TCP/IP, although this is its most popular implementation platform. Indeed HTTP can be "implemented on top of any other protocol on the Internet, or on other networks." HTTP only presumes a reliable transport; any protocol that provides such guarantees can be used.
Resources to be accessed by HTTP are identified using Uniform Resource Identifiers (URIs)—or, more specifically, Uniform Resource Locators (URLs)—using the http or https URI schemes.
The above is correct. but the way I see it is that the web pages both on the server end and your own end are written in hypertext markup language (HTML). When your computer asks a remote computer to send you a COPY of its webpage, you establish a connection with that remote computer using an agreed protocol called TCP/IP. As I understand it, the IP part connects the IP addresses together and then the TCP part establishes a sort of virtual connection between the two. Hypertext TRANSFER protocol (HTTP) is the agreed way (protocol) in which the remote computer copies its own data, packages it up and sends it down the virtual tube created by the TCP connection, and onwards to your own computer, at which time the (now) downloaded webpage is reassembled in your web browser from the data packets ( A packet is a sequence of bytes and consists of a header followed by a body. The header describes the packet's destination and, optionally, the routers to use for forwarding until it arrives at its final destination. The body contains the data IP is transmitting. ).
I'm not sure whether to describe the TCP as a hose-pipe and the HTTP as the water flowing in it but for newbies , this explanation might help get closer to the right concept.
Friday, May 28, 2010
Get Montha Name from a Number in SQL
DECLARE @monthInt int
SET @monthInt = 5
select datename(month,dateadd(month, @monthInt - 1, 0)) as MonthName
SET @monthInt = 5
select datename(month,dateadd(month, @monthInt - 1, 0)) as MonthName
Sunday, May 9, 2010
SQL SERVER – @@IDENTITY vs SCOPE_IDENTITY() vs IDENT_CURRENT – Retrieve Last Inserted Identity of Record
SELECT @@IDENTITY
It returns the last IDENTITY value produced on a connection, regardless of the table that produced the value, and regardless of the scope of the statement that produced the value.
@@IDENTITY will return the last identity value entered into a table in your current session. While @@IDENTITY is limited to the current session, it is not limited to the current scope. If you have a trigger on a table that causes an identity to be created in another table, you will get the identity that was created last, even if it was the trigger that created it.
SELECT SCOPE_IDENTITY()
It returns the last IDENTITY value produced on a connection and by a statement in the same scope, regardless of the table that produced the value.
SCOPE_IDENTITY(), like @@IDENTITY, will return the last identity value created in the current session, but it will also limit it to your current scope as well. In other words, it will return the last identity value that you explicitly created, rather than any identity that was created by a trigger or a user defined function.
SELECT IDENT_CURRENT(‘tablename’)
It returns the last IDENTITY value produced in a table, regardless of the connection that created the value, and regardless of the scope of the statement that produced the value.
IDENT_CURRENT is not limited by scope and session; it is limited to a specified table. IDENT_CURRENT returns the identity value generated for a specific table in any session and any scope.
To avoid the potential problems associated with adding a trigger later on, always use SCOPE_IDENTITY() to return the identity of the recently added row in your T SQL Statement or Stored Procedure.
Thursday, May 6, 2010
Download Sample Apps
for dowload sample projects click on below link
http://cid-b86cc93bd207b055.skydrive.live.com/browse.aspx/.Public/VS%20Projects
http://cid-b86cc93bd207b055.skydrive.live.com/browse.aspx/.Public/VS%20Projects
Wednesday, May 5, 2010
To replace the data in all colums in a database
Create PROC SearchAndReplace
(
@SearchStr nvarchar(100),
@ReplaceStr nvarchar(100)
)
AS
BEGIN
-- Purpose: To search all columns of all tables for a given search string and replace it with another string
-- Written by: Madhava Reddy Revuri
SET NOCOUNT ON
DECLARE @TableName nvarchar(256), @ColumnName nvarchar(128), @SearchStr2 nvarchar(110), @SQL nvarchar(4000), @RCTR int
SET @TableName = ''
SET @SearchStr2 = QUOTENAME('%' + @SearchStr + '%','''')
SET @RCTR = 0
WHILE @TableName IS NOT NULL
BEGIN
SET @ColumnName = ''
SET @TableName =
(
SELECT MIN(QUOTENAME(TABLE_SCHEMA) + '.' + QUOTENAME(TABLE_NAME))
FROM INFORMATION_SCHEMA.TABLES
WHERE TABLE_TYPE = 'BASE TABLE'
AND QUOTENAME(TABLE_SCHEMA) + '.' + QUOTENAME(TABLE_NAME) > @TableName
AND OBJECTPROPERTY(
OBJECT_ID(
QUOTENAME(TABLE_SCHEMA) + '.' + QUOTENAME(TABLE_NAME)
), 'IsMSShipped'
) = 0
)
WHILE (@TableName IS NOT NULL) AND (@ColumnName IS NOT NULL)
BEGIN
SET @ColumnName =
(
SELECT MIN(QUOTENAME(COLUMN_NAME))
FROM INFORMATION_SCHEMA.COLUMNS
WHERE TABLE_SCHEMA = PARSENAME(@TableName, 2)
AND TABLE_NAME = PARSENAME(@TableName, 1)
AND DATA_TYPE IN ('char', 'varchar', 'nchar', 'nvarchar')
AND QUOTENAME(COLUMN_NAME) > @ColumnName
)
IF @ColumnName IS NOT NULL
BEGIN
SET @SQL= 'UPDATE ' + @TableName +
' SET ' + @ColumnName
+ ' = REPLACE(' + @ColumnName + ', '
+ QUOTENAME(@SearchStr, '''') + ', ' + QUOTENAME(@ReplaceStr, '''') +
') WHERE ' + @ColumnName + ' LIKE ' + @SearchStr2
EXEC (@SQL)
SET @RCTR = @RCTR + @@ROWCOUNT
END
END
END
SELECT 'Replaced ' + CAST(@RCTR AS varchar) + ' occurence(s)' AS 'Outcome'
END
Create this proc in you database and excute it like below
EXEC SearchAndReplace 'SA', 'A'
(
@SearchStr nvarchar(100),
@ReplaceStr nvarchar(100)
)
AS
BEGIN
-- Purpose: To search all columns of all tables for a given search string and replace it with another string
-- Written by: Madhava Reddy Revuri
SET NOCOUNT ON
DECLARE @TableName nvarchar(256), @ColumnName nvarchar(128), @SearchStr2 nvarchar(110), @SQL nvarchar(4000), @RCTR int
SET @TableName = ''
SET @SearchStr2 = QUOTENAME('%' + @SearchStr + '%','''')
SET @RCTR = 0
WHILE @TableName IS NOT NULL
BEGIN
SET @ColumnName = ''
SET @TableName =
(
SELECT MIN(QUOTENAME(TABLE_SCHEMA) + '.' + QUOTENAME(TABLE_NAME))
FROM INFORMATION_SCHEMA.TABLES
WHERE TABLE_TYPE = 'BASE TABLE'
AND QUOTENAME(TABLE_SCHEMA) + '.' + QUOTENAME(TABLE_NAME) > @TableName
AND OBJECTPROPERTY(
OBJECT_ID(
QUOTENAME(TABLE_SCHEMA) + '.' + QUOTENAME(TABLE_NAME)
), 'IsMSShipped'
) = 0
)
WHILE (@TableName IS NOT NULL) AND (@ColumnName IS NOT NULL)
BEGIN
SET @ColumnName =
(
SELECT MIN(QUOTENAME(COLUMN_NAME))
FROM INFORMATION_SCHEMA.COLUMNS
WHERE TABLE_SCHEMA = PARSENAME(@TableName, 2)
AND TABLE_NAME = PARSENAME(@TableName, 1)
AND DATA_TYPE IN ('char', 'varchar', 'nchar', 'nvarchar')
AND QUOTENAME(COLUMN_NAME) > @ColumnName
)
IF @ColumnName IS NOT NULL
BEGIN
SET @SQL= 'UPDATE ' + @TableName +
' SET ' + @ColumnName
+ ' = REPLACE(' + @ColumnName + ', '
+ QUOTENAME(@SearchStr, '''') + ', ' + QUOTENAME(@ReplaceStr, '''') +
') WHERE ' + @ColumnName + ' LIKE ' + @SearchStr2
EXEC (@SQL)
SET @RCTR = @RCTR + @@ROWCOUNT
END
END
END
SELECT 'Replaced ' + CAST(@RCTR AS varchar) + ' occurence(s)' AS 'Outcome'
END
Create this proc in you database and excute it like below
EXEC SearchAndReplace 'SA', 'A'
Thursday, April 15, 2010
Split Function in Sql Server to break Comma-Separated Strings into Table
The below Split function is Table-valued function which would help us splitting comma-separated (or any other delimiter value) string to individual string.
CREATE FUNCTION dbo.Split(@String varchar(8000), @Delimiter char(1))
returns @temptable TABLE (items varchar(8000))
as
begin
declare @idx int
declare @slice varchar(8000)
select @idx = 1
if len(@String)<1 or @String is null return
while @idx!= 0
begin
set @idx = charindex(@Delimiter,@String)
if @idx!=0
set @slice = left(@String,@idx - 1)
else
set @slice = @String
if(len(@slice)>0)
insert into @temptable(Items) values(@slice)
set @String = right(@String,len(@String) - @idx)
if len(@String) = 0 break
end
return
end
split function can be Used as
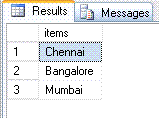
select top 10 * from dbo.split('Chennai,Bangalore,Mumbai',',')
would return
CREATE FUNCTION dbo.Split(@String varchar(8000), @Delimiter char(1))
returns @temptable TABLE (items varchar(8000))
as
begin
declare @idx int
declare @slice varchar(8000)
select @idx = 1
if len(@String)<1 or @String is null return
while @idx!= 0
begin
set @idx = charindex(@Delimiter,@String)
if @idx!=0
set @slice = left(@String,@idx - 1)
else
set @slice = @String
if(len(@slice)>0)
insert into @temptable(Items) values(@slice)
set @String = right(@String,len(@String) - @idx)
if len(@String) = 0 break
end
return
end
split function can be Used as
select top 10 * from dbo.split('Chennai,Bangalore,Mumbai',',')
would return

Above Split function can be used to pass parameter to IN clause in sql server.
Thursday, April 1, 2010
Convert DataTable to List and List to DataTable in Asp.net C# Use this Class
internal static class MapUtil
{
public static List ToList(this DataTable table)
{
List list = new List();
T item;
Type listItemType = typeof(T);
for (int i = 0; i < table.Rows.Count; i++)
{
item = (T)Activator.CreateInstance(listItemType);
MapRow(item, table, listItemType, i);
list.Add(item);
}
return list;
}
private static void MapRow(object vOb, DataTable table, Type type, int row)
{
for (int col = 0; col < table.Columns.Count; col++)
{
var columnName = table.Columns[col].ColumnName;
var prop = type.GetProperty(columnName);
object data ;
if (prop == null)
{
data = table.Rows[row][col].ToString();
}
else
{ data = GetData(prop, table.Rows[row][col]); }
prop.SetValue(vOb, data, null);
}
}
private static object GetData(PropertyInfo prop, object value)
{
if (prop.PropertyType.Name.Equals("Int32"))
return Convert.ToInt32(value);
if (prop.PropertyType.Name.Equals("Double"))
return Convert.ToDouble(value);
if (prop.PropertyType.Name.Equals("DateTime"))
return Convert.ToDateTime(value);
if (prop.PropertyType.Name.Equals("Guid"))
return new Guid(value.ToString());
return Convert.ToString(value).Trim();
}
public static DataTable ToDataTable(this IList list)
{
DataTable dt = null;
Type listType = list.GetType();
if (listType.IsGenericType)
{
Type elementType = listType.GetGenericArguments()[0];
dt = new DataTable(elementType.Name + "List");
MemberInfo[] miArray = elementType.GetMembers(BindingFlags.Public
BindingFlags.Instance);
foreach (MemberInfo mi in miArray)
{
if (mi.MemberType == MemberTypes.Property)
{
PropertyInfo pi = mi as PropertyInfo;
dt.Columns.Add(pi.Name, pi.PropertyType);
}
else if (mi.MemberType == MemberTypes.Field)
{
FieldInfo fi = mi as FieldInfo;
dt.Columns.Add(fi.Name, fi.FieldType);
}
}
IList il = list;
foreach (object record in il)
{
int i = 0;
object[] fieldValues = new object[dt.Columns.Count];
foreach (DataColumn c in dt.Columns)
{
MemberInfo mi = elementType.GetMember(c.ColumnName)[0];
if (mi.MemberType == MemberTypes.Property)
{
PropertyInfo pi = mi as PropertyInfo;
fieldValues[i] = pi.GetValue(record, null);
}
else if (mi.MemberType == MemberTypes.Field)
{
FieldInfo fi = mi as FieldInfo;
fieldValues[i] = fi.GetValue(record);
}
i++;
}
dt.Rows.Add(fieldValues);
}
}
return dt;
}
}
write this class in your app_code
after implimenting this class you will get youDataTable.ToList<> property and to yourList<>.ToDataTable() property they will return respective objects
Happy coding Guys
{
public static List
{
List
T item;
Type listItemType = typeof(T);
for (int i = 0; i < table.Rows.Count; i++)
{
item = (T)Activator.CreateInstance(listItemType);
MapRow(item, table, listItemType, i);
list.Add(item);
}
return list;
}
private static void MapRow(object vOb, DataTable table, Type type, int row)
{
for (int col = 0; col < table.Columns.Count; col++)
{
var columnName = table.Columns[col].ColumnName;
var prop = type.GetProperty(columnName);
object data ;
if (prop == null)
{
data = table.Rows[row][col].ToString();
}
else
{ data = GetData(prop, table.Rows[row][col]); }
prop.SetValue(vOb, data, null);
}
}
private static object GetData(PropertyInfo prop, object value)
{
if (prop.PropertyType.Name.Equals("Int32"))
return Convert.ToInt32(value);
if (prop.PropertyType.Name.Equals("Double"))
return Convert.ToDouble(value);
if (prop.PropertyType.Name.Equals("DateTime"))
return Convert.ToDateTime(value);
if (prop.PropertyType.Name.Equals("Guid"))
return new Guid(value.ToString());
return Convert.ToString(value).Trim();
}
public static DataTable ToDataTable(this IList list)
{
DataTable dt = null;
Type listType = list.GetType();
if (listType.IsGenericType)
{
Type elementType = listType.GetGenericArguments()[0];
dt = new DataTable(elementType.Name + "List");
MemberInfo[] miArray = elementType.GetMembers(BindingFlags.Public
BindingFlags.Instance);
foreach (MemberInfo mi in miArray)
{
if (mi.MemberType == MemberTypes.Property)
{
PropertyInfo pi = mi as PropertyInfo;
dt.Columns.Add(pi.Name, pi.PropertyType);
}
else if (mi.MemberType == MemberTypes.Field)
{
FieldInfo fi = mi as FieldInfo;
dt.Columns.Add(fi.Name, fi.FieldType);
}
}
IList il = list;
foreach (object record in il)
{
int i = 0;
object[] fieldValues = new object[dt.Columns.Count];
foreach (DataColumn c in dt.Columns)
{
MemberInfo mi = elementType.GetMember(c.ColumnName)[0];
if (mi.MemberType == MemberTypes.Property)
{
PropertyInfo pi = mi as PropertyInfo;
fieldValues[i] = pi.GetValue(record, null);
}
else if (mi.MemberType == MemberTypes.Field)
{
FieldInfo fi = mi as FieldInfo;
fieldValues[i] = fi.GetValue(record);
}
i++;
}
dt.Rows.Add(fieldValues);
}
}
return dt;
}
}
write this class in your app_code
after implimenting this class you will get youDataTable.ToList<> property and to yourList<>.ToDataTable() property they will return respective objects
Happy coding Guys
Wednesday, March 31, 2010
For better Understanding of Pivot,UnPivot,Rank Concepts go through this examples
Pivot
declare @Batting table
(Player varchar(10), Year int, Team varchar(10), HomeRuns int, primary key(Player,Year))
insert into @Batting
select 'A',2001,'Red Sox',13 union all
select 'A',2002,'Red Sox',23 union all
select 'A',2003,'Red Sox',19 union all
select 'A',2004,'Red Sox',14 union all
select 'A',2005,'Red Sox',11 union all
select 'B',2001,'Yankees',42 union all
select 'B',2002,'Yankees',39 union all
select 'B',2003,'Yankees',42 union all
select 'B',2004,'Yankees',29 union all
select 'C',2002,'Yankees',2 union all
select 'C',2003,'Yankees',3 union all
select 'C',2004,'Red Sox',6 union all
select 'C',2005,'Red Sox',9
select * from
(select Player,[Year],Team,HomeRuns from @Batting) as Bvt
pivot( count(HomeRuns) for team in ([Red Sox],[Yankees]))
as pvt
Rank
select Player, Year, HomeRuns, Rank() over (Partition BY [year] order by HomeRuns DESC) as Rank
from @Batting
UnPivot
Create TABLE pvt (VendorID int, Emp1 int, Emp2 int,
Emp3 int, Emp4 int, Emp5 int);
GO
INSERT INTO pvt VALUES (1,4,3,5,4,4);
INSERT INTO pvt VALUES (2,4,1,5,5,5);
INSERT INTO pvt VALUES (3,4,3,5,4,4);
INSERT INTO pvt VALUES (4,4,2,5,5,4);
INSERT INTO pvt VALUES (5,5,1,5,5,5);
GO
--Unpivot the table.
SELECT VendorID, Employee, Orders
FROM
(SELECT VendorID, Emp1, Emp2, Emp3, Emp4, Emp5
FROM pvt) p
UnPIVOT
( Orders FOR Employee IN
(Emp1, Emp2, Emp3, Emp4, Emp5)
) AS unpvt;
Drop pvt
Wednesday, March 10, 2010
Use of some tasks in SSIS
Aggregate
Calculates aggregations such as SUM, COUNT, AVG, MIN and MAX based on the values of a given numeric column. This transformation produces additional output records.
Adding aggregated information to your output. This can be useful for adding totals and sub-totals to your output.
Audit
Includes auditing information, such as computer name where the package runs, package version ID, task name, etc in the data flow.
Creates advanced logs which indicate where and when the package was executed, how long it took to run the package and the outcome of execution.
Character Map
Performs minor manipulations on string columns. Converts all letters to uppercase, lowercase, reverse bytes, etc.
Applying string manipulations prior to loading data into the data warehouse. You can also apply the same manipulations to the data while it is being loaded into the warehouse.
Conditional Split
Accepts an input and determines which destination to pipe the data into based on the result of an expression.
Cleansing the data to extract specific rows from the source. If a specific column does not conform to the predefined format (perhaps it has leading spaces or zeros), move such records to the error file.
Copy Column
Makes a copy of a single or multiple columns which will be further transformed by subsequent tasks in the package.
Extracting columns that need to be cleansed of leading / trailing spaces, applying character map transformation to uppercase all data and then load it into the table.
Data Conversion
Converts input columns from one data type to another.
Converting columns extracted from the data source to the proper data type expected by the data warehouse. Having such transformation options allows us the freedom of moving data directly from its source into the destination without having an intermediary staging database.
Data Mining Query
Queries a data mining model. Includes a query builder to assist you with development of Data Mining eXpressions (DMX) prediction queries.
Evaluating the input data set against a data mining model developed with Analysis Services.
Derived Column
Calculates new column value based on an existing column or multiple columns.
Removing leading and trailing spaces from a column. Add title of courtesy (Mr., Mrs., Dr, etc) to the name.
Export Column
Exports contents of large columns (TEXT, NTEXT, IMAGE data types) into files.
Saving large strings or images into files while moving the rest of the columns into a transactional database or data warehouse.
Fuzzy Grouping
Finds close or exact matches between multiple rows in the data source. Adds columns to the output including the values and similarity scores.
Cleansing data by translating various versions of the same value to a common identifier. For example, "Dr", "Dr.", "doctor", "M.D." should all be considered equivalent.
Fuzzy Lookup
Compares values in the input data source rows to values in the lookup table. Finds the exact matches as well as those values that are similar.
Cleansing data by translating various versions of the same value to a common identifier. For example, "Dr", "Dr.", "doctor", "M.D." should all be considered equivalent.
Import Column
Imports contents of a file and appends to the output. Can be used to append TEXT, NTEXT and IMAGE data columns to the input obtained from a separate data source.
This transformation could be useful for web content developers. For example, suppose you offer college courses online. Normalized course meta-data, such as course_id, name, and description is stored in a typical relational table. Unstructured course meta-data, on the other hand, is stored in XML files. You can use Import Column transformation to add XML meta-data to a text column in your course table.
Lookup
Joins the input data set to the reference table, view or row set created by a SQL statement to lookup corresponding values. If some rows in the input data do not have corresponding rows in the lookup table then you must redirect such rows to a different output.
Obtaining additional data columns. For example, the majority of employee demographic information might be available in a flat file, but other data such as department where each employee works, their employment start date and job grade might be available from a table in relational database.
Merge
Merges two sorted inputs into a single output based on the values of the key columns in each data set. Merged columns must have either identical or compatible data types. For example you can merge VARCHAR(30) and VARCHAR(50) columns. You cannot merge INT and DATETIME columns.
Combining the columns from multiple data sources into a single row set prior to populating a dimension table in a data warehouse. Using Merge transformation saves the step of having a temporary staging area. With prior versions of SQL Server you had to populate the staging area first if your data warehouse had multiple transactional data sources.
Merge Join
Joins two sorted inputs using INNER JOIN, LEFT OUTER JOIN or FULL OUTER JOIN algorithm. You can specify columns used for joining inputs.
Combining the columns from multiple data sources into a single row set prior to populating a dimension table in a data warehouse. Using Merge Join transformation saves the step of having a temporary staging area. With prior versions of SQL Server you had to populate the staging area first if your data warehouse had multiple transactional data sources.
Note that Merge and Merge Join transformations can only combine two data sets at a time. However, you could use multiple Merge Join transformations to include additional data sets.
Multicast
Similar to the conditional split transformation, but the entire data set is piped to multiple destinations.
Populating the relational warehouse as well as the source file with the output of a derived column transformation.
OLEDB Command
Runs a SQL command for each input data row. Normally your SQL statement will include a parameter (denoted by the question mark), for example: UPDATE employee_source SET has_been_loaded=1 WHERE employee_id=?
Setting the value of a column with BIT data type (perhaps called "has_been_loaded") to 1 after the data row has been loaded into the warehouse. This way the subsequent loads will only attempt importing the rows that haven't made it to the warehouse as of yet.
Percentage Sampling
Loads only a subset of your data, defined as the percentage of all rows in the data source. Note that rows are chosen randomly.
Limiting the data set during development phases of your project. Your data sources might contain billions of rows. Processing cubes against the entire data set can be prohibitively lengthy.
If you're simply trying to ensure that your warehouse functions properly and data values on transactional reports match the values obtained from your Analysis Services cubes you might wish to only load a subset of data into your cubes.
Pivot
Pivots the normalized data set by certain column to create a more easily readable output. Similar to PIVOT command in Transact-SQL. You can think of this transformation as converting rows into columns. For example if your input rows have customer, account number and account balance columns the output will have the customer and one column for each account.
Creating a row set that displays the table data in a more user-friendly format. The data set could be consumed by a web service or could be distributed to users through email.
Row count
Counts the number of transformed rows and store in a variable.
Determining the total size of your data set. You could also execute a different set of tasks based on the number of rows you have transformed. For example, if you increase the number of rows in your fact table by 5% you could perform no maintenance. If you increase the size of the table by 50% you might wish to rebuild the clustered index.
Row sampling
Loads only a subset of your data, defined as the number of rows. Note that rows are chosen randomly.
Limiting the data set during development phases of your project. Your data warehouse might contain billions of rows. Processing cubes against the entire data set can be prohibitively lengthy.
If you're simply trying to ensure that your warehouse functions properly and data values on transactional reports match the values obtained from your Analysis Services cubes you might wish to only load a subset of data into your cubes.
Script Component
Every data flow consists of three main components: source, destination and transformation. Script Component allows you to write transformations for otherwise un-supported source and destination file formats. Script component also allows you to perform transformations not directly available through the built-in transformation algorithms.
Custom transformations can call functions in managed assemblies, including .NET framework. This type of transformation can be used when the data source (or destination) file format cannot be managed by typical connection managers. For example, some log files might not have tabular data structures. At times you might also need to parse strings one character at a time to import only the needed data elements.
Much like Script Task the Script Component transformation must be written using Visual Basic .NET.
Slowly Changing Dimension
Maintains historical values of the dimension members when new members are introduced.
Useful for maintaining dimension tables in a data warehouse when maintaining historical dimension member values is necessary.
Sort
Sorts input by column values. You can sort the input by multiple columns in either ascending or descending order. The transformation also allows you to specify the precedence of columns used for sorting. This transformation could also discard the rows with duplicate sort values.
Ordering the data prior to loading it into a data warehouse. This could be useful if you're ordering your dimension by member name values as opposed to sorting by member keys.
You can also use Sort transformation prior to feeding the data as the input to the Merge Join or Merge transformation.
Term Extraction
Extracts terms (nouns and noun phrases) from the input text into the transformation output column.
Processing large text data and extracting main concepts. For example, you could extract the primary terms used in this section of SQLServerPedia by feeding the Term Extraction transformation the text column containing the entire section.
Term Lookup
Extracts terms from the input column with TEXT data type and match them with same or similar terms found in the lookup table. Each term found in the lookup table is scanned for in the input column. If the term is found the transformation returns the value as well as the number of times it occurs in the row. You can configure this transformation to perform case-sensitive search.
Analyzing large textual data for specific terms. For example, suppose you accept email feedback for latest version of your software. You might not have time to read through every single email messages that comes to the generic inbox. Instead you could use this task to look for specific terms of interest.
Union ALL
Combines multiple inputs into a single output. Rows are sorted in the order they're added to the transformation. You can ignore some columns from each output, but each output column must be mapped to at least one input column.
Import data from multiple disparate data sources into a single destination. For example, you could extract data from mail system, text file, Excel spreadsheet and Access database and populate a SQL Server table.
Unlike Merge and Merge Join transformations Union ALL can accept more than two inputs.
Unpivot
Opposite of Pivot transformation, Unpivot coverts columns into rows. It normalizes the input data set that has many duplicate values in multiple columns by creating multiple rows that have the same value in a single column.
For example if your input has a customer name and a separate column for checking and savings' accounts Unpivot can transform it into a row set that has customer, account and account balance columns.
Massaging a semi-structured input data file and convert it into a normalized input prior to loading data into a warehouse
Understanding difference between control flow and data flow in SSIS
You might wonder to find out difference between control flow designer and data flow designer. At a glance, they are similar, so why to divide it into 2 designer window. There must be a definite reason behind this. Yes, you are right if you think it as I think. Understanding nature of them will help you design scalable package. Below is the architecture background and nature that differentiates between them.
In architectural perspective, the smallest unit in control flow designer is task. And in data flow designer is component. Tasks require completion (success, failure or completion) before moving to next task. In data flow designer, one component will not wait for other component to work, all of them will work together in processing and managing data in streaming way.
In control flow designer, task functions as isolated unit of work. Concepts for tasks are Workflow orchestration, process oriented, serial or parallel execution and synchronous processing. Meanwhile components in data flow designer has different concept than control flow designer. Design concept for data flow designer are information oriented, data correlation and transformation, coordinated processing, streaming in nature, there must be sources and destinations. In data flow designer, component can performing data branching, data splitting and merging and provides parallel processing. All transformation works together among one another from source to destination, while at the same time data is still flowing from source. All component runs at the same time in a coordinated streaming fashion.
There could be more than one data flow task. Total execution package is calculated from first task begin to execute until last task. It is apparently clear, but it is important for there might be some tasks get executed in parallel. Maximizing parallel processing is recommended whenever possible to reduce overall package execution time.
Tuesday, January 26, 2010
How to Create a Cursor (small sample code)
declare @Variable nvarchar(50)
DECLARE Sample_cursor CURSOR FOR select oldrecord from tblOldTable --[declaring cursor for a select statement]
Open Sample_cursor --[opening cursor]
FETCH NEXT FROM Sample_cursor
INTO @Variable [Getting a single record in to declared varaible]
WHILE @@FETCH_STATUS = 0 [checking fetch status to loop the cursor]
BEGIN
//Here you have to write your logic
Update set NewRecord = 'something'
from tblNewTable where oldrecord = @Variable
FETCH NEXT FROM Sample_cursor
INTO @Variable
End
CLOSE Sample_cursor
DEALLOCATE Sample_cursor
Saturday, January 23, 2010
Setup and Execute an SSIS package as a SQL Server Job
SQL Server 2005 is different than SQL Server 2000. We now have to deal with a new security layer that just wasn’t there before. Therefore, things on the server have to be setup a bit differently these days.
Let’s walk through the execution/job flow:
The account that will be used to run and setup the job needs the roles of sysadmin, SQLAgentUserRole, SQLAgentReaderRole, and SQLAgentOperatorRole
The job needs to be run established to run under a Proxy account
Is always better to create the SSIS package using the account that will eventually run it – but that is not the real world. But in doing so, you are sure the job executor account will always have the right to run this SSIS package.
Let’s lay out the procedure needed
If you can, log in as SA. If not, then be prepared to grovel and beg. You need an account in order to do your work.
I. Create the job control account
Highlight Security->New Login, enter a new login name SUCH AS devlogin or nukeem, type your new password, and of course, your default database will most likely be your target database, but not always.
In Server Roles: check “sysadmin”
User mapping: the target database
Msdb database: Make sure to include SQLAgentUserRole, SQLAgentReaderRole, SQLAgentOperatorRole
Then click OK
II. Create SQL proxy account and associate proxy account with job executor account
Open up a new query window and run the following:
Use master
CREATE CREDENTIAL [MyCredential] WITH IDENTITY = 'yourdomain\myWindowAccount', secret = 'WindowLoginPassword'
GO
Use msdb
Sp_add_proxy @proxy_name='MyProxy', @credential_name='MyCredential'
Sp_grant_login_to_proxy @login_name=' devlogin', @proxy_name='MyProxy'
Sp_grant_proxy_to_subsystem @proxy_name='MyProxy', @subsystem_name='SSIS'
GO
III. Create SSIS package
In MS SQL Server Business Intelligence Development Studio, you use job executor account devlogin to create the SSIS package (DTS) and make sure you can execute this package in SQL Server Business Intelligence Development Studio. Compile/build this package.
IV. Create the job, schedule the job and run the job
In the SQL Server Management Studio, highlight the
1. SQL Server Agent -> Start.
2. Highlight Job ->New Job…, name it , SSISJobName.
A steps category will appear. Under the Steps list enter, New Step, name it, Step1 or whatever,
Type: SQL Server Integration Service Package
Run as: myProxy
Package source: File System or SQL server, which ever is correct
Browse to select your package file xxx.dtsx in the appropriate directory
Click Ok
Schedule your job and enable it
Now the job can be executed.
To Execute a job from a stored proc:
--Start Job
EXEC msdb.dbo.sp_start_job N'Weekly Accounts Payable Transaction History'
--Stop Job
EXEC msdb.dbo.sp_stop_job N'NightlyInventoryFeed'
--Info abt Job
EXEC msdb.dbo.sp_help_job
@job_name = N'FinanceBackup',
@job_aspect = N'ALL' ;
GO
SSRS--(Report Developing techinics)
Here we will investigate:
• Use of expressions that allow you to dynamically control nearly every aspect of reporting from control properties to data binding
• Common functions that allow run calculations and manipulate data within the report itself
• Custom code, used to build your own library of functions within the report.
We'll also set up a Matrix control and create a sub-report. Lastly, we will add some flair to the report by adding dynamic drills and sorting.
Getting started
In order to follow my examples, you will need to have SQL Server 2005, SQL Server 2005 Reporting Services, and Visual Studio 2005 correctly installed and configured. If you need some help with this, please refer back to the links in Part 1 of this series. Next, download the code file for this article (see the Code Download link in the speech bubble to the right of the article title). The code file contains a sample Visual Studio project and a SQL Script for creating the ReportDemo database. If you've not done so already, go ahead and create the database using the ReportingDemoDatabaseScript.sql script or, alternatively, by restoring the provided ReportingDemo.bak file.
Now start a new Business Intelligence project in Visual Studio 2005 (or using BIDS, which installs with SQL Server 2005). Select Project
Add Existing Item function to add to the project the shared datasource (ReportDb.rds) and the sample report, FirstReportMan.rdl. Next, open up the shared datasource and set the server, database, login and password to point to your copy of the database. We will start with the FirstReportMan.rdl report, so double-click on it in the solution explorer to load it into the designer.
Expressions
An expression is a short statement, written in code, which sets the value of a property. An expression can set the value of a property based on just about any data available in the report: parameters, report global values, fields in a dataset, and built-in functions.
SSRS 2005 has made some drastic improvements in how expressions are created. It now supplies an intuitive expression editor. If you scroll through the Properties window, you will notice that most of the properties of controls on the report can be hard-coded or can be set through expressions. (That's theoption you see everywhere.) You will also see buttons labeled fx in the pop-up Properties dialog. These buttons will access the expression editor.

The expression feature makes SSRS 2005 into an incredibly versatile tool, because it allows most aspects of the report, from the data it shows to how it shows it, to behave dynamically. Rather than using a hard-coded value for a particular property, the SSRS resolves the expression to set the value for the property.
Looking at our report, let's say we want it to highlight all the customers from a particular State. We could use the expression:
=iif(Fields!State.Value = "CA", "Bold", "Normal")
If we apply this expression to the detail row in the table and run the report it will bold the text for each row where the value of the State field is California. That's great if the data from California is all that you are interested in. However, it would be ridiculous to have one report for each state, so let's make this expression even more dynamic by adding a report parameter that will determine which State is highlighted when the report is run.
First, let's add the new parameter to the report. Open the FirstReportMan.rdl report and navigate to the Layout tab. From the Report menu select Report Parameters. When the dialog window opens, click the Add button at the bottom of the screen. Call the new parameter 'HighlightState' and set the available values as follows:
California CA
Florida FL
Louisiana LA
Illinois IL
Texas TX
Now click on OK.
Note:
You'll see that when setting up a list of pre-defined values for a parameter that there is a 'From Query' option. You can use this option by defining a dataset on the data tab of the report designer. For example, if we had a State table in the database we could define a dataset to retrieve the data for the parameter dropdown from that table. Once you choose the 'From Query' option, you select the dataset, the value field (this is the field from the dataset that contains the value passed to the report) and the label field (the field from the dataset that contains the value displayed to the user when they are prompted for parameters).
The next step is to set up the expression. Click on the table control on the report. When the table control is selected, an extra control tab appears at the top and left of the table. Click on the little 'row maker' icon, just to the left of the detail row. This allows you to set properties for the entire row. In the properties window select FontWeight and choosefrom the drop-down list to open the expression editor. Typing =iif( should give you Intellisense. You can use the expression builder to create the following line of code:
=iif(Fields!State.Value = Parameters!HighlightState.Value, "Bold", "Normal")

The iif is a flow control statement commonly used in SSRS expressions. Its format is:
iif (boolean statement, true result, false result)
If the boolean statement is true, then the true result is returned, and if not, the false result is returned. In this case, the boolean statement is asking: 'Does the state code equal the state code that was passed to the report? If it does, return the word 'bold'. If it does not, return the word 'normal''. The value returned is then used to set the property for that instance of the row.
Now switch to the Preview tab and select a State to highlight. When the report runs, all the rows with customers from the selected State should be displayed in bold.
Common functions
Let's navigate back to the expression editor. In the bottom half of the screen there are three columns. The first column lists different categories for building expressions. The last option is Common Functions. Expand the Common Functions node. Click on the Date & Time category. In the next column, double-click on one of the functions. You will see that it is added to the expression box at the top of the dialog box. Next, simply put the cursor in the expression box after the function. If you then type in the opening left bracket you should instantly see Intellisense for the function you selected.

Let's use the Year function in the report to display only the year in which someone was born, instead of their full birth date. Right-click on the field that displays the date of birth and select Properties. On the General tab, find the Value field and click the fx button to bring up the expression editor. Change expression to read.
=Year(Fields!DateOfBirth.Value)
There we have it. It's a good idea to preview the report now.
Also of note here are the aggregate functions. These functions assist you in working with all of the data in a dataset. For example, let's say your report is an order form with a list of items and their prices. You can use the Sum function on the Price field to create a total price on the report. In a different example, if you had a report that listed all the purchase dates and the total amount of each purchase, you could use the AVG function to get the average purchase price for that customer.
Global variables
Let's go back again to the expression editor. This time, click on Globals in the first column of the expression editor. In the second column, you will see the list of the global variables that are provided to the report.
In this example, we are going to use the global variables to create a page-numbering scheme for our report. First, add a footer to the FirstReportMan.rdl report. You enable this by going to the Layout tab and selecting the Report Footer option from the Report main menu. Now that you have a footer, drag four text boxes into the footer section. Set their font properties to 8 pt, bold. Set the text for each text box as follows:
Page
=Globals!PageNumber
of
=Globals!TotalPages
Switch to the Preview tab and run the report. You will now have a footer on each page that looks something like 'Page 1 of 5'.
Some other globals worth noting are:
• ExecutionTime – this tells you how long it took to run the report
• ReportServerUrl – this allows you to verify that you are getting your report from the correct source
• UserID - this shows under which User ID the report was run
You can use these global variables to build some basic diagnostics into your reporting. You could also add these variables to the report footer and use a parameter to hide or show them. That way, even in production, your users can see a tidy, clean report, but you can see the same report with all the extra information on it.
Custom functions
There are about 100 common functions in SSRS 2005, and they can handle most of what you will need to do. Occasionally, however, you will still need to set an expression with more control than the common functions can manage. So, to make SSRS even more flexible, you can write custom VB.NET or C# functions and use them in expressions.
Now we are going to add a custom function to the FirstReportMan.rdl report.
Open the report and navigate to the Layout tab. From the Report menu select Report Properties and then jump to the Code tab. We are going to write a custom function that returns a different color, depending on the value that is passed to it. We will then use that function to set the background color for the status field in the report detail table.
Copy the following code into the code window:
Public Function GetColor(ByVal status as String) as String
IF status = "100" Then
Return "White"
End IF
IF status = "101" Then
Return "Yellow"
End IF
IF status = "102" Then
Return "Tomato"
End IF
End Function
Click OK and close the window.
Note:
The full list of available colors is found in the Color dropdown list in the properties window.
Now that we have a function that returns color names we need to wire up that function to an expression. Click on the Customer Status cell and open the Properties window. Find the Background Color property and choose Expression from the dropdown. Add the following line of code to create an expression:
=code.GetColor(Fields!CustomerStatus.Value)
When the report runs and this expression is resolved, SSRS will call your GetColor function and pass the value of the customer status for that instance of the row to the function. The function takes over and decides which color should be returned. SSRS then uses that value as the value for the background property for that cell.

Please note that custom functions must be called using =code..
Now navigate to the Preview tab and run the report..
Subreports
A subreport is a report that is embedded into another report. Subreports can take parameters and execute their own datasets. A key aspect to note is that a subreport in SSRS is actually just another report (unlike some reporting tools, where a subreport is a special construct). In fact, in SSRS you can execute a subreport on its own.
To add a subreport to a report, you simply drag a subreport control onto the report and tell it which report to display. If the subreport requires parameters, you have to tell the main report which value to pass to the subreport. It's actually very simple.
Let's add a new report to the project and call it MainReport.rdl. Create a new dataset using the shared datasource and the query:
SELECT CustomerID, FirstName, LastName FROM Customer
Switch to the Layout tab. Drag a table on the report detail area. Set up the first column to display the customer's first name (by dragging that column from the Datasets tab into the Detail row) and set up the second column to display the customer's last name. Label the third column 'Address'. Preview the report, just to be sure it works.
Create another report, and call this one MySubReport.rdl. This time, create a dataset that uses the shared data source, and use the following query text:
SELECT Address, City, State, ZipCode
FROM Customer
WHERE (CustomerID = @CustomerID)
In the Layout tab, use text boxes to create the address layout, as shown in figure 5. You can simply drag the text boxes onto the screen by clicking on the field in datasets tab and dragging it onto design surface. You will also note that when you do this, the expression used to set the value property for the textbox uses the First() function. This function will use the value from the first row returned by the dataset. All other rows returned are ignored.

Now preview the report and use '100' for the CustomerID parameter.
Let's jump back to the MainReport.rdl. To embed the subreport, drag a SubReport control into the detail cell for the column you labeled 'Address'. Right-click on the SubReport control and select Properties. In the Properties dialog choose MySubReport from the subreport dropdown.

Next, switch to the Parameters tab. This is where you connect your subreport to the main report. You do this by indicating which value from the main report is to be passed to the subreport to fulfill its parameter requirements.
In the Parameter Name column choose CustomerID and in the Parameter Value column choose =Fields!CustomerID.Value. This will wire up the subreport to whichever customer is being displayed in the row of the table.

Click OK to close the dialog, and then preview the main report.
The Matrix
It's this question that drives us, Neo. What is the Matrix? OK, I'll stop right here. You can insert your own slam to the second two movies. However, there is a really cool control in SSRS called the Matrix control. The Matrix is used to create pivot table style reports. We are going to set up a simple Matrix control to show us which customers, in which State, have which status.
First, start a new report called MatrixReport.rdl. Add our standard dataset where you use the shared data source, and then add the Select * from Customer query.
Navigate to the Layout tab and drag a new Matrix control onto the page. Where it says Rows, drag the State field from the dataset. Where it says Columns, drag the CustomerStatus field from the dataset. Drag first name and last name into the data area on the Matrix control. After a little formatting, it should resemble this:

When the report runs, it looks like this:

Adding drill downs
The drill down functionality in SSRS allows you to have areas of your report that can expand and collapse, much like a tree view.
First, start a new report called AdvancedTable.rdl. Add our standard dataset, where you use the shared data source and the Select * from Customer query.
Navigate to the Layout tab and drag a new table control onto the page. The first thing we need to do is to add a group to the table. Click the table to highlight it, then right-click on the little box with three horizontal lines in it that appear at the left side of the table at the beginning of detail row. Select Insert Group. When the Group Dialog appears use =Fields!State.Value as the expression, so that the report now groups on State. Now drag the State field into the first column on the Group row. Next, drag the First Name, Last Name and City fields into the detail row. Add some formatting, and preview the report.

We've now performed a grouping, but we still have to enable the drilldown. Click on the table to highlight it. Right-click on the nub that appears, just to the left of the detail row. Select Properties. When the Properties window opens, expand the visibility section. Set the Hidden property to True and set the ToggleItem property to State. The Hidden property determines the state of the row when the report is first run. If we set it to True then the data is collapsed and hidden. By setting the ToggleItem property to State, when the report is run a little + sign appears next to it when the report is run and it works like a tree view.
Switch to the Preview tab and run the report. Now only the States appear, but you can see the customer in each State by using the tree-style +/- controls.

Adding dynamic sorting
It is incredibly easy to add sorting to your table. Let's re-open the FirstReportMan.rdl report. Navigate to the Layout tab of the report designer. Click in the cell labeled First Name in the header of the table. Right-click and select Properties. Switch to the Interactive Sort tab. Check the checkbox for 'Add an interactive sort action to this textbox'. Next, set the Sort expression to the value that is displayed in the column – in this case =Fields!FirstName.Value. Now repeat this process for the rest of the report.

Preview the report, and you should have interactive sorting on each column.

• Use of expressions that allow you to dynamically control nearly every aspect of reporting from control properties to data binding
• Common functions that allow run calculations and manipulate data within the report itself
• Custom code, used to build your own library of functions within the report.
We'll also set up a Matrix control and create a sub-report. Lastly, we will add some flair to the report by adding dynamic drills and sorting.
Getting started
In order to follow my examples, you will need to have SQL Server 2005, SQL Server 2005 Reporting Services, and Visual Studio 2005 correctly installed and configured. If you need some help with this, please refer back to the links in Part 1 of this series. Next, download the code file for this article (see the Code Download link in the speech bubble to the right of the article title). The code file contains a sample Visual Studio project and a SQL Script for creating the ReportDemo database. If you've not done so already, go ahead and create the database using the ReportingDemoDatabaseScript.sql script or, alternatively, by restoring the provided ReportingDemo.bak file.
Now start a new Business Intelligence project in Visual Studio 2005 (or using BIDS, which installs with SQL Server 2005). Select Project
Add Existing Item function to add to the project the shared datasource (ReportDb.rds) and the sample report, FirstReportMan.rdl. Next, open up the shared datasource and set the server, database, login and password to point to your copy of the database. We will start with the FirstReportMan.rdl report, so double-click on it in the solution explorer to load it into the designer.
Expressions
An expression is a short statement, written in code, which sets the value of a property. An expression can set the value of a property based on just about any data available in the report: parameters, report global values, fields in a dataset, and built-in functions.
SSRS 2005 has made some drastic improvements in how expressions are created. It now supplies an intuitive expression editor. If you scroll through the Properties window, you will notice that most of the properties of controls on the report can be hard-coded or can be set through expressions. (That's the

The expression feature makes SSRS 2005 into an incredibly versatile tool, because it allows most aspects of the report, from the data it shows to how it shows it, to behave dynamically. Rather than using a hard-coded value for a particular property, the SSRS resolves the expression to set the value for the property.
Looking at our report, let's say we want it to highlight all the customers from a particular State. We could use the expression:
=iif(Fields!State.Value = "CA", "Bold", "Normal")
If we apply this expression to the detail row in the table and run the report it will bold the text for each row where the value of the State field is California. That's great if the data from California is all that you are interested in. However, it would be ridiculous to have one report for each state, so let's make this expression even more dynamic by adding a report parameter that will determine which State is highlighted when the report is run.
First, let's add the new parameter to the report. Open the FirstReportMan.rdl report and navigate to the Layout tab. From the Report menu select Report Parameters. When the dialog window opens, click the Add button at the bottom of the screen. Call the new parameter 'HighlightState' and set the available values as follows:
California CA
Florida FL
Louisiana LA
Illinois IL
Texas TX
Now click on OK.
Note:
You'll see that when setting up a list of pre-defined values for a parameter that there is a 'From Query' option. You can use this option by defining a dataset on the data tab of the report designer. For example, if we had a State table in the database we could define a dataset to retrieve the data for the parameter dropdown from that table. Once you choose the 'From Query' option, you select the dataset, the value field (this is the field from the dataset that contains the value passed to the report) and the label field (the field from the dataset that contains the value displayed to the user when they are prompted for parameters).
The next step is to set up the expression. Click on the table control on the report. When the table control is selected, an extra control tab appears at the top and left of the table. Click on the little 'row maker' icon, just to the left of the detail row. This allows you to set properties for the entire row. In the properties window select FontWeight and choose
=iif(Fields!State.Value = Parameters!HighlightState.Value, "Bold", "Normal")

The iif is a flow control statement commonly used in SSRS expressions. Its format is:
iif (boolean statement, true result, false result)
If the boolean statement is true, then the true result is returned, and if not, the false result is returned. In this case, the boolean statement is asking: 'Does the state code equal the state code that was passed to the report? If it does, return the word 'bold'. If it does not, return the word 'normal''. The value returned is then used to set the property for that instance of the row.
Now switch to the Preview tab and select a State to highlight. When the report runs, all the rows with customers from the selected State should be displayed in bold.
Common functions
Let's navigate back to the expression editor. In the bottom half of the screen there are three columns. The first column lists different categories for building expressions. The last option is Common Functions. Expand the Common Functions node. Click on the Date & Time category. In the next column, double-click on one of the functions. You will see that it is added to the expression box at the top of the dialog box. Next, simply put the cursor in the expression box after the function. If you then type in the opening left bracket you should instantly see Intellisense for the function you selected.

Let's use the Year function in the report to display only the year in which someone was born, instead of their full birth date. Right-click on the field that displays the date of birth and select Properties. On the General tab, find the Value field and click the fx button to bring up the expression editor. Change expression to read.
=Year(Fields!DateOfBirth.Value)
There we have it. It's a good idea to preview the report now.
Also of note here are the aggregate functions. These functions assist you in working with all of the data in a dataset. For example, let's say your report is an order form with a list of items and their prices. You can use the Sum function on the Price field to create a total price on the report. In a different example, if you had a report that listed all the purchase dates and the total amount of each purchase, you could use the AVG function to get the average purchase price for that customer.
Global variables
Let's go back again to the expression editor. This time, click on Globals in the first column of the expression editor. In the second column, you will see the list of the global variables that are provided to the report.
In this example, we are going to use the global variables to create a page-numbering scheme for our report. First, add a footer to the FirstReportMan.rdl report. You enable this by going to the Layout tab and selecting the Report Footer option from the Report main menu. Now that you have a footer, drag four text boxes into the footer section. Set their font properties to 8 pt, bold. Set the text for each text box as follows:
Page
=Globals!PageNumber
of
=Globals!TotalPages
Switch to the Preview tab and run the report. You will now have a footer on each page that looks something like 'Page 1 of 5'.
Some other globals worth noting are:
• ExecutionTime – this tells you how long it took to run the report
• ReportServerUrl – this allows you to verify that you are getting your report from the correct source
• UserID - this shows under which User ID the report was run
You can use these global variables to build some basic diagnostics into your reporting. You could also add these variables to the report footer and use a parameter to hide or show them. That way, even in production, your users can see a tidy, clean report, but you can see the same report with all the extra information on it.
Custom functions
There are about 100 common functions in SSRS 2005, and they can handle most of what you will need to do. Occasionally, however, you will still need to set an expression with more control than the common functions can manage. So, to make SSRS even more flexible, you can write custom VB.NET or C# functions and use them in expressions.
Now we are going to add a custom function to the FirstReportMan.rdl report.
Open the report and navigate to the Layout tab. From the Report menu select Report Properties and then jump to the Code tab. We are going to write a custom function that returns a different color, depending on the value that is passed to it. We will then use that function to set the background color for the status field in the report detail table.
Copy the following code into the code window:
Public Function GetColor(ByVal status as String) as String
IF status = "100" Then
Return "White"
End IF
IF status = "101" Then
Return "Yellow"
End IF
IF status = "102" Then
Return "Tomato"
End IF
End Function
Click OK and close the window.
Note:
The full list of available colors is found in the Color dropdown list in the properties window.
Now that we have a function that returns color names we need to wire up that function to an expression. Click on the Customer Status cell and open the Properties window. Find the Background Color property and choose Expression from the dropdown. Add the following line of code to create an expression:
=code.GetColor(Fields!CustomerStatus.Value)
When the report runs and this expression is resolved, SSRS will call your GetColor function and pass the value of the customer status for that instance of the row to the function. The function takes over and decides which color should be returned. SSRS then uses that value as the value for the background property for that cell.

Please note that custom functions must be called using =code.
Now navigate to the Preview tab and run the report..
Subreports
A subreport is a report that is embedded into another report. Subreports can take parameters and execute their own datasets. A key aspect to note is that a subreport in SSRS is actually just another report (unlike some reporting tools, where a subreport is a special construct). In fact, in SSRS you can execute a subreport on its own.
To add a subreport to a report, you simply drag a subreport control onto the report and tell it which report to display. If the subreport requires parameters, you have to tell the main report which value to pass to the subreport. It's actually very simple.
Let's add a new report to the project and call it MainReport.rdl. Create a new dataset using the shared datasource and the query:
SELECT CustomerID, FirstName, LastName FROM Customer
Switch to the Layout tab. Drag a table on the report detail area. Set up the first column to display the customer's first name (by dragging that column from the Datasets tab into the Detail row) and set up the second column to display the customer's last name. Label the third column 'Address'. Preview the report, just to be sure it works.
Create another report, and call this one MySubReport.rdl. This time, create a dataset that uses the shared data source, and use the following query text:
SELECT Address, City, State, ZipCode
FROM Customer
WHERE (CustomerID = @CustomerID)
In the Layout tab, use text boxes to create the address layout, as shown in figure 5. You can simply drag the text boxes onto the screen by clicking on the field in datasets tab and dragging it onto design surface. You will also note that when you do this, the expression used to set the value property for the textbox uses the First() function. This function will use the value from the first row returned by the dataset. All other rows returned are ignored.

Now preview the report and use '100' for the CustomerID parameter.
Let's jump back to the MainReport.rdl. To embed the subreport, drag a SubReport control into the detail cell for the column you labeled 'Address'. Right-click on the SubReport control and select Properties. In the Properties dialog choose MySubReport from the subreport dropdown.

Next, switch to the Parameters tab. This is where you connect your subreport to the main report. You do this by indicating which value from the main report is to be passed to the subreport to fulfill its parameter requirements.
In the Parameter Name column choose CustomerID and in the Parameter Value column choose =Fields!CustomerID.Value. This will wire up the subreport to whichever customer is being displayed in the row of the table.

Click OK to close the dialog, and then preview the main report.
The Matrix
It's this question that drives us, Neo. What is the Matrix? OK, I'll stop right here. You can insert your own slam to the second two movies. However, there is a really cool control in SSRS called the Matrix control. The Matrix is used to create pivot table style reports. We are going to set up a simple Matrix control to show us which customers, in which State, have which status.
First, start a new report called MatrixReport.rdl. Add our standard dataset where you use the shared data source, and then add the Select * from Customer query.
Navigate to the Layout tab and drag a new Matrix control onto the page. Where it says Rows, drag the State field from the dataset. Where it says Columns, drag the CustomerStatus field from the dataset. Drag first name and last name into the data area on the Matrix control. After a little formatting, it should resemble this:

When the report runs, it looks like this:

Adding drill downs
The drill down functionality in SSRS allows you to have areas of your report that can expand and collapse, much like a tree view.
First, start a new report called AdvancedTable.rdl. Add our standard dataset, where you use the shared data source and the Select * from Customer query.
Navigate to the Layout tab and drag a new table control onto the page. The first thing we need to do is to add a group to the table. Click the table to highlight it, then right-click on the little box with three horizontal lines in it that appear at the left side of the table at the beginning of detail row. Select Insert Group. When the Group Dialog appears use =Fields!State.Value as the expression, so that the report now groups on State. Now drag the State field into the first column on the Group row. Next, drag the First Name, Last Name and City fields into the detail row. Add some formatting, and preview the report.

We've now performed a grouping, but we still have to enable the drilldown. Click on the table to highlight it. Right-click on the nub that appears, just to the left of the detail row. Select Properties. When the Properties window opens, expand the visibility section. Set the Hidden property to True and set the ToggleItem property to State. The Hidden property determines the state of the row when the report is first run. If we set it to True then the data is collapsed and hidden. By setting the ToggleItem property to State, when the report is run a little + sign appears next to it when the report is run and it works like a tree view.
Switch to the Preview tab and run the report. Now only the States appear, but you can see the customer in each State by using the tree-style +/- controls.

Adding dynamic sorting
It is incredibly easy to add sorting to your table. Let's re-open the FirstReportMan.rdl report. Navigate to the Layout tab of the report designer. Click in the cell labeled First Name in the header of the table. Right-click and select Properties. Switch to the Interactive Sort tab. Check the checkbox for 'Add an interactive sort action to this textbox'. Next, set the Sort expression to the value that is displayed in the column – in this case =Fields!FirstName.Value. Now repeat this process for the rest of the report.

Preview the report, and you should have interactive sorting on each column.

SSRS -- Part 1(Steps To Configure SQL Server Reporting Services (2005))
Steps To Configure SQL Server Reporting Services (2005)
1. First Click on Start up menu then select Programs->Microsoft Sql Server 2005->Configuration Tools->Reporting Services Configuration and click, you will get a following window.

2. Check the Machine Name and Instance Name. Machine Name should be the name of your machine (Computer) and Instance Name should be the name of installed Sql Server on your machine (MSSQLSERVER).Click on Connect button to connect with Sql Server Reporting services.
3. After that you will see the following window.

Check the Report Server Status Here. If the server is already started Start button will be disabled and if not Start button will be enabled. If it is enabled click on that to start Report Server.
4. Now you have to specify Report Server Virtual Directory and Report Manager Virtual Directory for Report Server. Click on Report Server Virtual Directory tab, following window will be opened.

The window will take the Default values for Name and Website. Click on New button to assign a new website Name (follow step 7 to cerate a new Website for Report Server) as Report Server Virtual Directory. You can also configure Reporting Services for SSL connections. To do so, simply check the Require Secure Socket Layer (SSL) connections checkbox and enter the appropriate values into the drop-down supplied.
5. Click on Report Manager Virtual Directory tab following window will be prompted.

The window will take the Default values for Name and Website. Click on New button to assign a new website Name as Report Manager Virtual Directory.
6. The Virtual Directory(Website) Name for Report Server And Report Manager Should be same. Check it carefully while specifying Virtual Directory name whether Report Server And Report Manager both are pointing to same Virtual Directory(Website) or not.
7. Before specifying Virtual Directory(Website) name to Report Server And Report Manager you should create a Website manually using IIS.
To do so start IIS Manager from the Run dialog box
A.1 On the Start menu, click Run.
A.2 In the Open box, type inetmgr and click OK.
Creating the Web Site
Now that IIS Manager is started, you are ready to create a virtual directory.
To create a Web Site by using IIS Manager
B.1. In IIS Manager, expand the local computer and Right-click the Web site , point to New, and then click Web Site.
B.2. In the Web Site Creation Wizard, click Next.
B.3. In the Description box, type a name for the Web Site and then click Next.
B.4.Provide the Port for the Website Say “8000” or you can give any port no. Default Port value is 80.
B.5. In the Path box, type or browse to the physical directory that contains the virtual directory, and then click Next. Note that you can select an existing folder or create a new one (say D:\NewFolder).
B.6. Select the check boxes for the access permissions that you want to assign to your users. By default, the Read and Run Scripts check boxes are selected; these permissions enable you to run ASP.NET pages for many common scenarios.
B.7. Click Next and then click Finish.
B.8.Now Right Clicks on the Web Site you just created and point to Properties and click. A property page will open. Click on Asp.Net tab and Select the Asp version from the drop down for your computer.
B.9.Now Click on Directory Security tab and Click on First Edit Button and Check only Enable Anonymous access .By Default it is checked. Enter User Name as “MachineName\Administrator” and Password as “Your Administrator password” for Anonymous access only to make the Report browse able by other users. Uncheck the other entire Authentication
8. Click on Windows Service Identity tab, following window will open.

9. Click on Web service Identity tab ,you will get following window

Specify the application pool for Report Server and Report Manager .By default it will take the default value. You can assign a new one by just clicking on New Button and creating a new application pool.
10. Now Click on Database Connection tab, you will see the following window

Click on Connect Button to connect with your server. Following window will be prompted.

Provide the Server name as Your Machine Name(Computer Name) and in Credentials Type Drop down select Sql Server authentication and enter your Sql server username and password.
Next Database name value is the default value you can create a new database. To create a new database click on New Button, following window will open.

Here Specify a Sql Server instance. Server Name should be your machine name and in Credentials type drop down select Sql server authentication and provide the Sql Server username and password and click on ok to complete the creation.
11. Click on Initialization tab to see initialize status of the Report Server. Check the checkbox to initialize.
12. Also you have to start Sql Server Agent. To do so click on Start up menu->Control panel->Administrative Tools->Services. A Services page will open. Right click on Sql Server Agent and click on Start from the popup menu to start the Agent.
13. Now the Sql Server Reporting Services Configuration is completed. To check whether the Reporting Services are running or not on your Computer (Server), open any browser and Type the URL http://localhost:8000/reports.
You will be redirected to a Sql Server Reporting Services Home page (http://localhost:8000/reports/Pages/Folder.aspx) that will make sure that your Report Server is running successfully. Here the port no (e.g. 8000) is your Website Port No that you have already created for you Report server.
To Deploy and Run the Report On Report server
14. Now to deploy and run your Created Sql Server Report on the Report Server you have to specify two things.
a. Open Your report in Design mode->Go to Project menu in the tool bar->Navigate to Report Project Properties and click. You will see a Report Project Properties page. Leave the TargetReportFolder as Default.
b. Change the TargetServerUrl of Report to http://localhost:8000/ReportServer.By Default it will take http://localhost/ReportSerevr.
15. Right Click on Report and Select Deploy from pop up menu to deploy the Report and hit Run to run the report on report Server. Now your are done with your Report creation.
1. First Click on Start up menu then select Programs->Microsoft Sql Server 2005->Configuration Tools->Reporting Services Configuration and click, you will get a following window.

2. Check the Machine Name and Instance Name. Machine Name should be the name of your machine (Computer) and Instance Name should be the name of installed Sql Server on your machine (MSSQLSERVER).Click on Connect button to connect with Sql Server Reporting services.
3. After that you will see the following window.

Check the Report Server Status Here. If the server is already started Start button will be disabled and if not Start button will be enabled. If it is enabled click on that to start Report Server.
4. Now you have to specify Report Server Virtual Directory and Report Manager Virtual Directory for Report Server. Click on Report Server Virtual Directory tab, following window will be opened.

The window will take the Default values for Name and Website. Click on New button to assign a new website Name (follow step 7 to cerate a new Website for Report Server) as Report Server Virtual Directory. You can also configure Reporting Services for SSL connections. To do so, simply check the Require Secure Socket Layer (SSL) connections checkbox and enter the appropriate values into the drop-down supplied.
5. Click on Report Manager Virtual Directory tab following window will be prompted.

The window will take the Default values for Name and Website. Click on New button to assign a new website Name as Report Manager Virtual Directory.
6. The Virtual Directory(Website) Name for Report Server And Report Manager Should be same. Check it carefully while specifying Virtual Directory name whether Report Server And Report Manager both are pointing to same Virtual Directory(Website) or not.
7. Before specifying Virtual Directory(Website) name to Report Server And Report Manager you should create a Website manually using IIS.
To do so start IIS Manager from the Run dialog box
A.1 On the Start menu, click Run.
A.2 In the Open box, type inetmgr and click OK.
Creating the Web Site
Now that IIS Manager is started, you are ready to create a virtual directory.
To create a Web Site by using IIS Manager
B.1. In IIS Manager, expand the local computer and Right-click the Web site , point to New, and then click Web Site.
B.2. In the Web Site Creation Wizard, click Next.
B.3. In the Description box, type a name for the Web Site and then click Next.
B.4.Provide the Port for the Website Say “8000” or you can give any port no. Default Port value is 80.
B.5. In the Path box, type or browse to the physical directory that contains the virtual directory, and then click Next. Note that you can select an existing folder or create a new one (say D:\NewFolder).
B.6. Select the check boxes for the access permissions that you want to assign to your users. By default, the Read and Run Scripts check boxes are selected; these permissions enable you to run ASP.NET pages for many common scenarios.
B.7. Click Next and then click Finish.
B.8.Now Right Clicks on the Web Site you just created and point to Properties and click. A property page will open. Click on Asp.Net tab and Select the Asp version from the drop down for your computer.
B.9.Now Click on Directory Security tab and Click on First Edit Button and Check only Enable Anonymous access .By Default it is checked. Enter User Name as “MachineName\Administrator” and Password as “Your Administrator password” for Anonymous access only to make the Report browse able by other users. Uncheck the other entire Authentication
8. Click on Windows Service Identity tab, following window will open.

In Service Account TextBox enter Local System. Click on Built-in-Account and select Local System from the Drop Down and click on Apply button.
9. Click on Web service Identity tab ,you will get following window

Specify the application pool for Report Server and Report Manager .By default it will take the default value. You can assign a new one by just clicking on New Button and creating a new application pool.
10. Now Click on Database Connection tab, you will see the following window

Click on Connect Button to connect with your server. Following window will be prompted.

Provide the Server name as Your Machine Name(Computer Name) and in Credentials Type Drop down select Sql Server authentication and enter your Sql server username and password.
Next Database name value is the default value you can create a new database. To create a new database click on New Button, following window will open.

Here Specify a Sql Server instance. Server Name should be your machine name and in Credentials type drop down select Sql server authentication and provide the Sql Server username and password and click on ok to complete the creation.
11. Click on Initialization tab to see initialize status of the Report Server. Check the checkbox to initialize.
12. Also you have to start Sql Server Agent. To do so click on Start up menu->Control panel->Administrative Tools->Services. A Services page will open. Right click on Sql Server Agent and click on Start from the popup menu to start the Agent.
13. Now the Sql Server Reporting Services Configuration is completed. To check whether the Reporting Services are running or not on your Computer (Server), open any browser and Type the URL http://localhost:8000/reports.
You will be redirected to a Sql Server Reporting Services Home page (http://localhost:8000/reports/Pages/Folder.aspx) that will make sure that your Report Server is running successfully. Here the port no (e.g. 8000) is your Website Port No that you have already created for you Report server.
To Deploy and Run the Report On Report server
14. Now to deploy and run your Created Sql Server Report on the Report Server you have to specify two things.
a. Open Your report in Design mode->Go to Project menu in the tool bar->Navigate to Report Project Properties and click. You will see a Report Project Properties page. Leave the TargetReportFolder as Default.
b. Change the TargetServerUrl of Report to http://localhost:8000/ReportServer.By Default it will take http://localhost/ReportSerevr.
15. Right Click on Report and Select Deploy from pop up menu to deploy the Report and hit Run to run the report on report Server. Now your are done with your Report creation.
Friday, January 22, 2010
State Managment , Response & Request , GET & POST
Web applications are based on stateless HTTP protocol which does not retain any information about user requests. In typical client and server Communication using HTTP protocol, page is created each time the page is requested.
Developer is forced to implement various state management techniques when developing applications which provide customized content and which "remembers" the user.
We can classify state management techniques as client side state management and server side state management. Each technique has its own pros and cons.
Client side State management Options:
ASP.NET provides various client side state management options like Cookies, Query Strings (URL), Hidden fields, View State and Control state.
Cookie:
A cookie is a small piece of text stored on user's computer. Usually, information is stored as name-value pairs. Cookies are used by websites to keep track of visitors. Every time a user visits a website, cookies are retrieved from user machine and help identify the user.
Advantages:
• Simplicity
Disadvantages:
• Cookies can be disabled on user browsers
• Cookies are transmitted for each HTTP request/response causing overhead on bandwidth
Hidden fields:
Hidden fields are used to store data at the page level. As its name says, these fields are not rendered by the browser. It's just like a standard control for which you can set its properties. Whenever a page is submitted to server, hidden fields values are also posted to server along with other controls on the page. We can still use it to store insignificant data. We can use hidden fields in ASP.NET pages using following syntax
Advantages:
• Simple to implement for a page specific data
• Can store small amount of data so they take less size.
Disadvantages:
• Hidden field values can be clearly visible when passed over a network
View State:
View State can be used to store state information for a single user. View State is a built in feature in web controls to persist data between page post backs. You can set View State on/off for each control using EnableViewState property. By default, EnableViewState property will be set to true.
View state information of all the controls on the page will be submitted to server on each post back. To reduce performance penalty, disable View State for all the controls for which you don't need state. (Data grid usually doesn't need to maintain state).
You can also disable View State for the entire page by adding EnableViewState=false to @page directive.
View state data is encoded as binary Base64
- encoded which add approximately 30% overhead. Care must be taken to ensure view state for a page is smaller in size.
Advantages:
• Simple for page level data
• Encrypted
• Can be set at the control level
Disadvantages:
• Overhead in encoding View State values
• Makes a page heavy
Query strings:
Query strings are usually used to send information from one page to another page. They are passed along with URL in clear text
Query strings seem to be redundant.
Most browsers impose a limit of 255 characters on URL length. We can only pass smaller amounts of data using query strings.
Since Query strings are sent in clear text, we can also encrypt query values. Also, keep in mind that characters that are not valid in a URL must be encoded using Server.UrlEncode.
Advantages:
• Simple to Implement
Disadvantages:
• Human Readable
• Client browser limit on URL length
• Easily modified by end user
Control State:
Control State is new mechanism in ASP.NET 2.0 which addresses some of the shortcomings of View State. Control state can be used to store critical, private information across post backs.
Control state is another type of state container reserved for controls to maintain their core behavioral functionality whereas View State only contains state to maintain control's contents (UI).
Control State shares same memory data structures with View State. Control State can be propagated even though the View State for the control is disabled.
Server Side State management:
As name implies, state information will be maintained on the server. Application, Session, Cache and Database are different mechanisms for storing state on the server.
Application object:
Application object is used to store data which is visible across entire application and shared across multiple user sessions. Data which needs to be persisted for entire life of application should be stored in application object.
We should write to application variable only in application_Onstart event (global.asax)
Below code sample gives idea
Application.Lock();
Application["mydata"]="mydata";
Application.UnLock();
Session object:
Session object is used to store state specific information per client basis. It is specific to particular user. Session data persists for the duration of user session you can store session's data on web server in different ways. Session state can be configured using thesection in the application's web.config file.
Configuration information:
cookieless = <"true" "false">
timeout =
sqlconnectionstring =
server =
port =
Mode:
This setting supports three options. They are InProc, SQLServer, and State Server
Timeout:
This indicates the Session timeout vale in minutes. This is the duration for which a user's session is active. Note that the session timeout is a sliding value; Default session timeout value is 20 minutes
Caching
It is a way to store the frequently used data into the server memory which can be retrieved very quickly. And so provides both scalability and performance. For example if user is required to fetch the same data from database frequently then the resultant data can be stored into the server memory and later retrieved in very less time (better performance). And the same time the application can serve more page request in the same time (scalability).
Drawback: Suppose the server memory is filled with the data then the remaining part of the data is stored into the disk which slower the complete system performance. That's why self limiting caching techniques are best; where once the server memory gets filled the data has been selectively removed from the server memory to ensure that the application performance is not degraded.
Caching Types: Basically, caching is of two types:
1. Output caching - The rendered html page is stored into the cache before sending it to the client. Now, if the same page is requested by some other client the already rendered htm page is retrieved from the server memory and sent to the client, which saves the time requires rendering and processing the complete page.
Note: The page is automatically removed when the application is recompiled.
<@ OutputCache Duration="20" VaryByParam="None">
2. Data Caching - The important pieces of information, that are time consuming and frequently requested, are stored into the cache. For example a data set retrieved from the database. It is very similar to application state but it is more server friendly as the data gets removed once the cache is filled.
Profiles
if you remember that when we used the Session variables in Asp.net a unique Session ID was generated for every user. This ID was generated automatically. if you tried printing out the Session ID code is below it will be different for each computer and each session that's why its unique.
Response.Write(Session.SessionID); // This will print roahoq55lpkgn055qwcwod45
Let's see some examples that how we can use profile object in our Asp.net web applications
First in order to create unique id for the anonymous users we need to add a tag in the web.config file.
This tag means that we will create a Profile ID for the anonymous users.
New thing to note about the Profile tag is that you cannot make the variables on the fly. I mean you cannot do something like this:
Sample2.aspx: We just simply put the Name from the TextBox in the profile object
Profile["Name"] = txtName.Text;
Response.Redirect("Sample2_1.aspx");
Sample2_1.aspx: This page recieved the Name from the Sample2.aspx page and prints the result
if (!Page.IsPostBack)
{
if (Profile["Name"] != null)
{
string name = Profile["Name"].ToString();
Response.Write(name);
}
}
This will result in an error saying that it was not able to recognize the Name variable. For this to work
we need to define the Profile variables and what better place to do this than in the web.config file.
Let's see how we can pass values from one page to another using the Profile object.
As we see that we have introduced some new tags in the profile class. All the tags are placed inside the profile tag which also contains the properties tag. You can define any number of profile variables in the add tag. In this example we are just using the "Name" tag. Now let's see how we can access the values of the Profile variables that we have just set in the web.config file.
Our "Sample2.aspx" page contains a simple TextBox and the button. When the button is clicked the values are transferred to another page Sample2_1.aspx page.
Now let's see the button click code:
void Button1_Click(object sender, EventArgs e)
{
Profile["Name"] = txtName.Text;
Response.Redirect("Sample2_1.aspx");
}
We simply assigns the value of the TextBox to the Profile variable called "Name" and than redirected the page to the Sample2_1.aspx page where we can now display the value.
Sample2_1.aspx:
if (!Page.IsPostBack)
{
if (Profile["FirstName"] != null)
{
string name = Profile["FirstName"].ToString();
Response.Write(name);
}
}
On this page we simply retrieve the value from the Profile object and prints out the value.
Let's see if we can transfer an arrayList from one page to another by putting it in the profile object.
Sample3.aspx
void Button1_Click(object sender, EventArgs e)
{
System.Collections.ArrayList aList = new System.Collections.ArrayList();
aList.Add("Azam");
aList.Add("John");
aList.Add("Saif");
Profile["Name"] = (object) aList; // You may not need the (object) conversion since this is an implicit conversion
Response.Redirect("Sample3_1.aspx");
}
In the above code we just added few items in the arrayList object and than put that arrayList in the Profile object. And finally we redirected the to Sample3_1.aspx page.
Sample3_1.aspx
if (!Page.IsPostBack)
{
if (Profile["Name"] != null)
{
System.Collections.ArrayList myList = (System.Collections.ArrayList)Profile["Name"];
for (int i = 0; i < myList.Count; i++)
{
Response.Write(myList[i].ToString());
}
}
}
In this code sample we just iterate through the list and print all the values contained in the arrayList.
If you run this code you will get an error saying that the Profile object is not compatible with the type. For this to work you need to make a small change in the web.config file.
Now if you see the web.config file above you can see that I have defined a type attribute which has the "System.Collections.ArrayList" type.
Now if you run your page it will work fine and display the results on the Sample3_1.aspx page.
There is much more you can do with profiles like sending classes information by serializing them and inheriting from profiles and using role based profiles.
POST && GET
The difference between METHOD="GET" (the default) and METHOD="POST" is primarily defined in terms of form data encoding. The official recommendations say that "GET" should be used if and only if the form processing is idempotent, which typically means a pure query form. Generally it is advisable to do so. There are, however, problems related to long URLs and non-ASCII character repertoires which can make it necessary to use "POST" even for idempotent processing. As a simplification, we might say that "GET" is basically for just getting (retrieving) data whereas "POST" may involve anything, like storing or updating data, or ordering a product, or sending E-mail.
when u r using get method u can see the data in URL even if u r using any king of state management technique.
there no relation between query string and Get method both are different concepts.
the only similarity is viewing data in URL.
Request, Response Objects
Request and Response objects represent information coming into the Web server from the browser and information going out from the server to the browser. The Request object is called the input object and the Response object is called the output object.
Response Object
As mentioned above, the Response object represents a valid HTTP response that was received from the server. The response header properties are read-only. Notable properties of the object are as follows:
Body: Gets the body of the HTTP response. Only the portion of the body stored in the response buffer is returned
BytesRecv: Gets the number of bytes the client received in the response
BytesSent: Gets the number of bytes sends in the HTTP request
CodePage: Gets or sets the code page used for setting the body of the HTTP response
ContentLength: Gets the size, in bytes, of the response body
Headers: Gets a collection of headers in the response
HeaderSize: Gets the combined size, in bytes, of all the response headers
HTTPVersion: Gets the HTTP version used by the server for this response
Path: Gets the path that was requested
Port: Gets the server port used for the request
ResultCode: Gets the server's response status code
Server: Gets the name of the server that sent the response
TTFB: Gets the number of milliseconds that have passed before the first byte of the response was received
TTLB: Gets the number of milliseconds that passed before the last byte of the response was received
UseSSL: Checks whether the server and client used an SSL connection for the request and response
Request Object
As mentioned above, the Request object represents an HTTP request before it has been sent to the server. Notable properties of this object are as follows:
Body: Gets/Sets the HTTP request body
CodePage: Gets/Sets the code page for the request body
EncodeBody: Gets/Sets whether URL ACT automatically encodes the request body
EncodeQueryAsUTF8: Gets/Sets whether UTF-8 ACT automatically encodes the request's query string
Headers: Gets the HTTP Headers collection object
HTTPVersion: Gets/Sets the HTTP version
Path: Gets/Sets the HTTP path
ResponseBufferSize: Gets/Sets the size of the buffer used to store the response body
Verb: Gets/Sets the HTTP method verb
Developer is forced to implement various state management techniques when developing applications which provide customized content and which "remembers" the user.
We can classify state management techniques as client side state management and server side state management. Each technique has its own pros and cons.
Client side State management Options:
ASP.NET provides various client side state management options like Cookies, Query Strings (URL), Hidden fields, View State and Control state.
Cookie:
A cookie is a small piece of text stored on user's computer. Usually, information is stored as name-value pairs. Cookies are used by websites to keep track of visitors. Every time a user visits a website, cookies are retrieved from user machine and help identify the user.
Advantages:
• Simplicity
Disadvantages:
• Cookies can be disabled on user browsers
• Cookies are transmitted for each HTTP request/response causing overhead on bandwidth
Hidden fields:
Hidden fields are used to store data at the page level. As its name says, these fields are not rendered by the browser. It's just like a standard control for which you can set its properties. Whenever a page is submitted to server, hidden fields values are also posted to server along with other controls on the page. We can still use it to store insignificant data. We can use hidden fields in ASP.NET pages using following syntax
Advantages:
• Simple to implement for a page specific data
• Can store small amount of data so they take less size.
Disadvantages:
• Hidden field values can be clearly visible when passed over a network
View State:
View State can be used to store state information for a single user. View State is a built in feature in web controls to persist data between page post backs. You can set View State on/off for each control using EnableViewState property. By default, EnableViewState property will be set to true.
View state information of all the controls on the page will be submitted to server on each post back. To reduce performance penalty, disable View State for all the controls for which you don't need state. (Data grid usually doesn't need to maintain state).
You can also disable View State for the entire page by adding EnableViewState=false to @page directive.
View state data is encoded as binary Base64
- encoded which add approximately 30% overhead. Care must be taken to ensure view state for a page is smaller in size.
Advantages:
• Simple for page level data
• Encrypted
• Can be set at the control level
Disadvantages:
• Overhead in encoding View State values
• Makes a page heavy
Query strings:
Query strings are usually used to send information from one page to another page. They are passed along with URL in clear text
Query strings seem to be redundant.
Most browsers impose a limit of 255 characters on URL length. We can only pass smaller amounts of data using query strings.
Since Query strings are sent in clear text, we can also encrypt query values. Also, keep in mind that characters that are not valid in a URL must be encoded using Server.UrlEncode.
Advantages:
• Simple to Implement
Disadvantages:
• Human Readable
• Client browser limit on URL length
• Easily modified by end user
Control State:
Control State is new mechanism in ASP.NET 2.0 which addresses some of the shortcomings of View State. Control state can be used to store critical, private information across post backs.
Control state is another type of state container reserved for controls to maintain their core behavioral functionality whereas View State only contains state to maintain control's contents (UI).
Control State shares same memory data structures with View State. Control State can be propagated even though the View State for the control is disabled.
Server Side State management:
As name implies, state information will be maintained on the server. Application, Session, Cache and Database are different mechanisms for storing state on the server.
Application object:
Application object is used to store data which is visible across entire application and shared across multiple user sessions. Data which needs to be persisted for entire life of application should be stored in application object.
We should write to application variable only in application_Onstart event (global.asax)
Below code sample gives idea
Application.Lock();
Application["mydata"]="mydata";
Application.UnLock();
Session object:
Session object is used to store state specific information per client basis. It is specific to particular user. Session data persists for the duration of user session you can store session's data on web server in different ways. Session state can be configured using the
Configuration information:
cookieless = <"true" "false">
timeout =
sqlconnectionstring =
server =
port =
Mode:
This setting supports three options. They are InProc, SQLServer, and State Server
Timeout:
This indicates the Session timeout vale in minutes. This is the duration for which a user's session is active. Note that the session timeout is a sliding value; Default session timeout value is 20 minutes
Caching
It is a way to store the frequently used data into the server memory which can be retrieved very quickly. And so provides both scalability and performance. For example if user is required to fetch the same data from database frequently then the resultant data can be stored into the server memory and later retrieved in very less time (better performance). And the same time the application can serve more page request in the same time (scalability).
Drawback: Suppose the server memory is filled with the data then the remaining part of the data is stored into the disk which slower the complete system performance. That's why self limiting caching techniques are best; where once the server memory gets filled the data has been selectively removed from the server memory to ensure that the application performance is not degraded.
Caching Types: Basically, caching is of two types:
1. Output caching - The rendered html page is stored into the cache before sending it to the client. Now, if the same page is requested by some other client the already rendered htm page is retrieved from the server memory and sent to the client, which saves the time requires rendering and processing the complete page.
Note: The page is automatically removed when the application is recompiled.
<@ OutputCache Duration="20" VaryByParam="None">
2. Data Caching - The important pieces of information, that are time consuming and frequently requested, are stored into the cache. For example a data set retrieved from the database. It is very similar to application state but it is more server friendly as the data gets removed once the cache is filled.
Profiles
if you remember that when we used the Session variables in Asp.net a unique Session ID was generated for every user. This ID was generated automatically. if you tried printing out the Session ID code is below it will be different for each computer and each session that's why its unique.
Response.Write(Session.SessionID); // This will print roahoq55lpkgn055qwcwod45
Let's see some examples that how we can use profile object in our Asp.net web applications
First in order to create unique id for the anonymous users we need to add a tag in the web.config file.
This tag means that we will create a Profile ID for the anonymous users.
New thing to note about the Profile tag is that you cannot make the variables on the fly. I mean you cannot do something like this:
Sample2.aspx: We just simply put the Name from the TextBox in the profile object
Profile["Name"] = txtName.Text;
Response.Redirect("Sample2_1.aspx");
Sample2_1.aspx: This page recieved the Name from the Sample2.aspx page and prints the result
if (!Page.IsPostBack)
{
if (Profile["Name"] != null)
{
string name = Profile["Name"].ToString();
Response.Write(name);
}
}
This will result in an error saying that it was not able to recognize the Name variable. For this to work
we need to define the Profile variables and what better place to do this than in the web.config file.
Let's see how we can pass values from one page to another using the Profile object.
As we see that we have introduced some new tags in the profile class. All the tags are placed inside the profile tag which also contains the properties tag. You can define any number of profile variables in the add tag. In this example we are just using the "Name" tag. Now let's see how we can access the values of the Profile variables that we have just set in the web.config file.
Our "Sample2.aspx" page contains a simple TextBox and the button. When the button is clicked the values are transferred to another page Sample2_1.aspx page.
Now let's see the button click code:
void Button1_Click(object sender, EventArgs e)
{
Profile["Name"] = txtName.Text;
Response.Redirect("Sample2_1.aspx");
}
We simply assigns the value of the TextBox to the Profile variable called "Name" and than redirected the page to the Sample2_1.aspx page where we can now display the value.
Sample2_1.aspx:
if (!Page.IsPostBack)
{
if (Profile["FirstName"] != null)
{
string name = Profile["FirstName"].ToString();
Response.Write(name);
}
}
On this page we simply retrieve the value from the Profile object and prints out the value.
Let's see if we can transfer an arrayList from one page to another by putting it in the profile object.
Sample3.aspx
void Button1_Click(object sender, EventArgs e)
{
System.Collections.ArrayList aList = new System.Collections.ArrayList();
aList.Add("Azam");
aList.Add("John");
aList.Add("Saif");
Profile["Name"] = (object) aList; // You may not need the (object) conversion since this is an implicit conversion
Response.Redirect("Sample3_1.aspx");
}
In the above code we just added few items in the arrayList object and than put that arrayList in the Profile object. And finally we redirected the to Sample3_1.aspx page.
Sample3_1.aspx
if (!Page.IsPostBack)
{
if (Profile["Name"] != null)
{
System.Collections.ArrayList myList = (System.Collections.ArrayList)Profile["Name"];
for (int i = 0; i < myList.Count; i++)
{
Response.Write(myList[i].ToString());
}
}
}
In this code sample we just iterate through the list and print all the values contained in the arrayList.
If you run this code you will get an error saying that the Profile object is not compatible with the type. For this to work you need to make a small change in the web.config file.
Now if you see the web.config file above you can see that I have defined a type attribute which has the "System.Collections.ArrayList" type.
Now if you run your page it will work fine and display the results on the Sample3_1.aspx page.
There is much more you can do with profiles like sending classes information by serializing them and inheriting from profiles and using role based profiles.
POST && GET
The difference between METHOD="GET" (the default) and METHOD="POST" is primarily defined in terms of form data encoding. The official recommendations say that "GET" should be used if and only if the form processing is idempotent, which typically means a pure query form. Generally it is advisable to do so. There are, however, problems related to long URLs and non-ASCII character repertoires which can make it necessary to use "POST" even for idempotent processing. As a simplification, we might say that "GET" is basically for just getting (retrieving) data whereas "POST" may involve anything, like storing or updating data, or ordering a product, or sending E-mail.
when u r using get method u can see the data in URL even if u r using any king of state management technique.
there no relation between query string and Get method both are different concepts.
the only similarity is viewing data in URL.
Request, Response Objects
Request and Response objects represent information coming into the Web server from the browser and information going out from the server to the browser. The Request object is called the input object and the Response object is called the output object.
Response Object
As mentioned above, the Response object represents a valid HTTP response that was received from the server. The response header properties are read-only. Notable properties of the object are as follows:
Body: Gets the body of the HTTP response. Only the portion of the body stored in the response buffer is returned
BytesRecv: Gets the number of bytes the client received in the response
BytesSent: Gets the number of bytes sends in the HTTP request
CodePage: Gets or sets the code page used for setting the body of the HTTP response
ContentLength: Gets the size, in bytes, of the response body
Headers: Gets a collection of headers in the response
HeaderSize: Gets the combined size, in bytes, of all the response headers
HTTPVersion: Gets the HTTP version used by the server for this response
Path: Gets the path that was requested
Port: Gets the server port used for the request
ResultCode: Gets the server's response status code
Server: Gets the name of the server that sent the response
TTFB: Gets the number of milliseconds that have passed before the first byte of the response was received
TTLB: Gets the number of milliseconds that passed before the last byte of the response was received
UseSSL: Checks whether the server and client used an SSL connection for the request and response
Request Object
As mentioned above, the Request object represents an HTTP request before it has been sent to the server. Notable properties of this object are as follows:
Body: Gets/Sets the HTTP request body
CodePage: Gets/Sets the code page for the request body
EncodeBody: Gets/Sets whether URL ACT automatically encodes the request body
EncodeQueryAsUTF8: Gets/Sets whether UTF-8 ACT automatically encodes the request's query string
Headers: Gets the HTTP Headers collection object
HTTPVersion: Gets/Sets the HTTP version
Path: Gets/Sets the HTTP path
ResponseBufferSize: Gets/Sets the size of the buffer used to store the response body
Verb: Gets/Sets the HTTP method verb
Subscribe to:
Comments (Atom)